
It's been a rocky week for stocks as falling yields raised fears the global economic recovery from the pandemic will come in fits and starts.
On Thursday, the 10-year yield touched 1.25%, its lowest level since February. The S&P 500 is set to close out the week barely positive.
CNBC's "Trading Nation" asked two technicians to cut through the noise and share the chart that explains the market dynamics in play right now.
Get Tri-state area news and weather forecasts to your inbox. Sign up for NBC New York newsletters.
Bill Baruch, president of Blue Line Capital, is watching the Federal Reserve.
"It's most important to highlight the Fed's balance sheet, not the massive expansion we've seen over the last decade, but really the Fed's balance sheet over just this year," Baruch said Thursday. "They're buying debt, and ultimately, what you're seeing is as you're underpinning the Treasury complex you're suppressing yields."
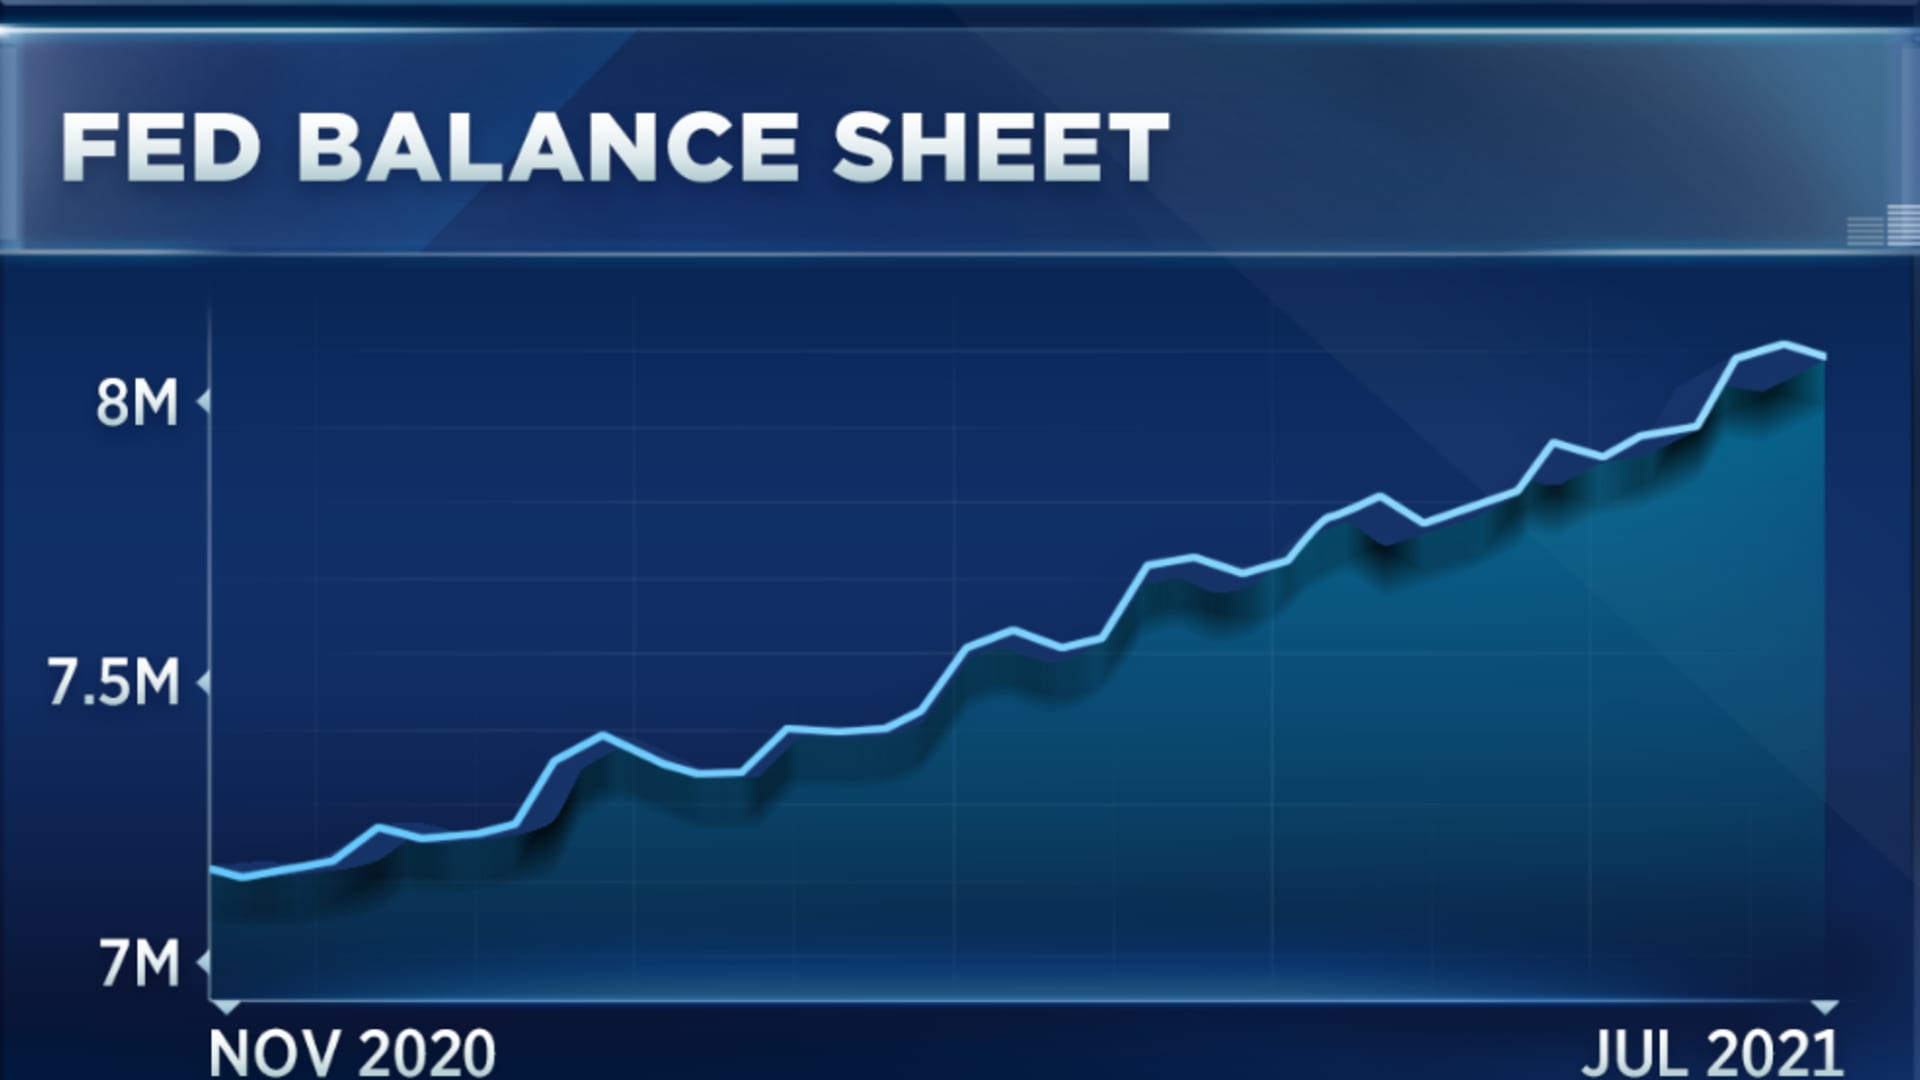
Meanwhile, the Fed at its June meeting revised up inflation expectations for the year, giving the impression it will taper the balance sheet sooner rather than later. But, Baruch says bond investors believe that will be harder in practice than in theory, leading to another drop in yields and rise in bond prices. Bond prices and yields move inversely to one another.
Money Report


Bond yields are unlikely to move much lower, though, according to Craig Johnson, chief market technician at Piper Sandler.
"I don't think you're going to get the 10-year bond yields to pull back a lot further from here," Johnson said during the same interview. "You can see that we've pulled back to almost the rising 200-day moving average," highlighting that as an area of support.
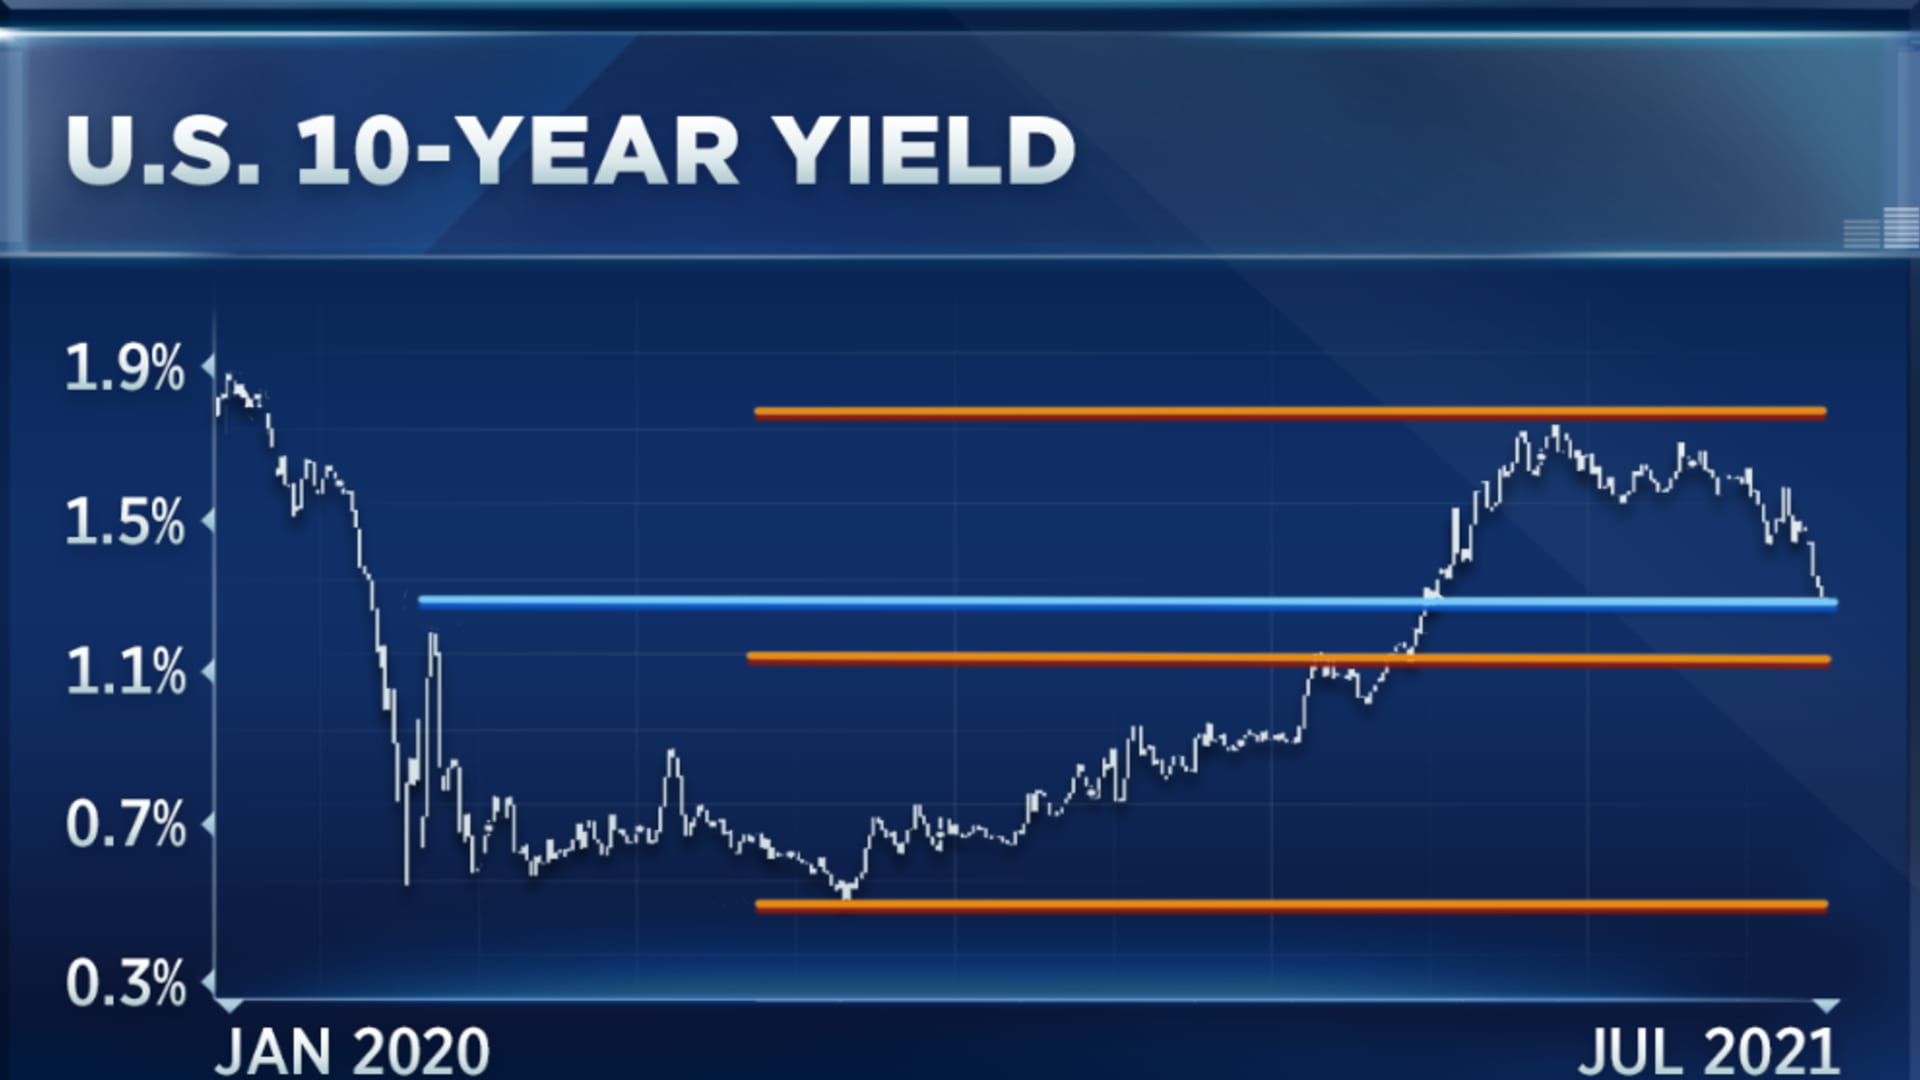
"We've come from 50 basis points to 1.77% just a few months ago," he said. "Then that decline in yields started to accelerate. As that started to happen, people started putting into the narrative of the market that perhaps again runaway inflation wasn't going to occur. That went away, and then they started saying, 'Wow, we put all this stimulus into the economy, but yet we're not seeing any sort of inflation happening. Maybe the entire recovery narrative is fading to a degree.'"
He says both of those narratives have hit an extreme. Should the 10-year break below 1.23%, though, he says, it could spook investors by suggesting the recovery has a long way to go.